- Lumida Ledger
- Posts
- 2023 Wrapped: Market Rally, Mag 7 Deep Dive, Bridgewater vs Goldman
2023 Wrapped: Market Rally, Mag 7 Deep Dive, Bridgewater vs Goldman
Justin Guilder & Ram Ahluwalia
December 31, 2023
Welcome back to the Lumida Ledger. Here’s a preview of what we cover this week:
Macro: Fed Rate Cut & Bridgewater vs. Goldman, Labor markets, Recession, & Retail Spending Trends
Markets: Mag 7 Deep Dive, Small Cap breakthroughs
AI: Enterprises to Invest $40 Billion in Gen AI in 2024
Digital Assets: Crypto Chart Book; Gemini / Genesis news
Top 10 Stocking Stuffers
This week we had a special Christmas episode where Ram and Justin embraced the festive spirits and had a lively discussion around holidays & the new year. They ran down their curated list of 10 Stocking Stuffers and 10 Stocks to buy for 2024, alternately discussing each item.
These ranged from technology stocks and private equity firms to sleep and mindfulness products for health and wellness.
Tune in for the delightful mix of holiday cheer, market insights and more.

Macro
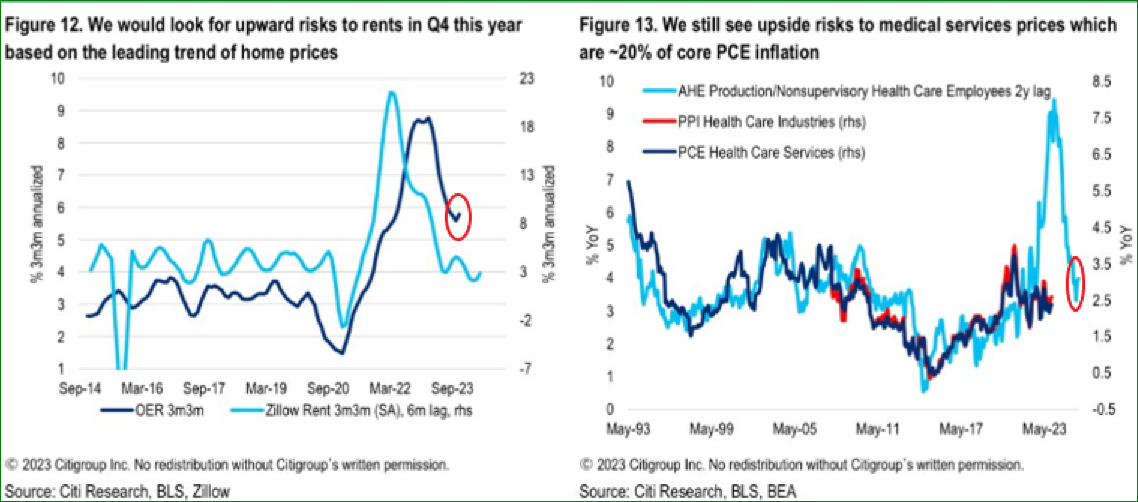
Will the Fed Cut Rates?
Check out these charts from Citi.
It’s hard to see how the Fed cuts rates in Q1 with this data.
CME futures markets are pricing in 73% chance of rate cuts as of yesterday (down from 80% last week)
Fading this is one of the few high probability opportunities out there.
Upward price risk to rents and medical services is trending up. We expect the rate cuts are unlikely in Q1 due to inflation.
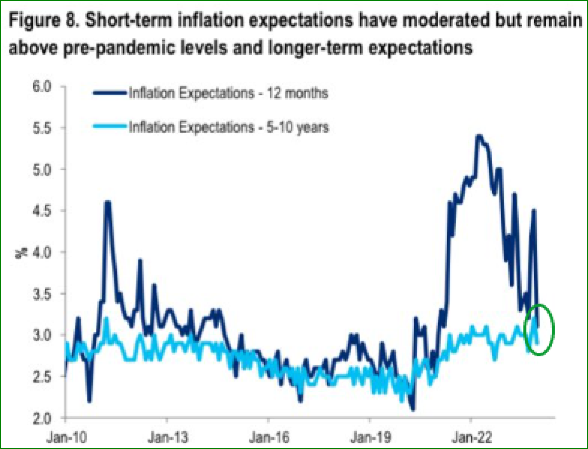
Short term Inflation expectations: Rate cuts are unlikely scenario is Q1’ 2024 with moderate inflation
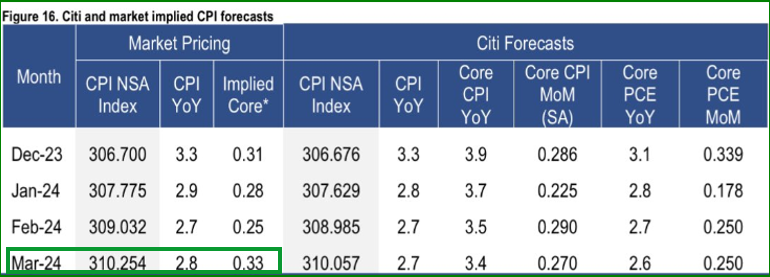
CPI index is trending upwards.
Core inflation is also expected to rise at a slower rate.
We believe that Inflation risks remain intact in the near future as evident from the table below.
Goldman Sachs Vs Bridgewater Fight
Over the last few years, we’ve seen a big fight on the macro front between Bridgewater and Goldman Sachs.
Here’s who won each round.
2022: Bridgewater wins
2023: Goldman wins
2024: ???
1) Goldman’s view: 10/10 landing
Goldman: “We have not only landed softly a perfect soft landing - but that the principal concerns of [ low growth or inflation or inflation resurgence ] is likely behind us.”
2) Bridgewater view: The Grind Ahead
Bridgewater: ‘Growth in the US has been resilient and markets are pricing for that to continue. We disagree. As past supports fade and rates stay high, we expect balance sheets to deteriorate and growth to gradually grind down’
No firm has more access to research and data - including the inner workings of central banks - than Bridgewater.
Still, when Bridgewater’s view was Consensus at the end of ‘23, markets moved the other way.
One way to approach this intellectual debate is to engage deeply with the content.
That’s what 99% of analysts do.
(And that can be stimulating for sure.)
What does Non-Consensus Look Like?
My approach is to say ‘Which view is Consensus?’
Predicting the future of a dynamic market economy with animal spirits is impossible.
However, identifying Consensus is doable.
You can measure credit spreads, sentiment, valuation, and analyst expectations.
Here’s a metaphor.
Markets, like Tarzan, like to swing one from vine to the other.
Think of each vine as a narrative.
At peak swing, the vine is ‘Consensus’.
Each vine at first grasp, like a pendulum, starts out-of-consensus.
Then the vine (narrative) gathers momentum while the old vine recedes.
When the new view is fully Consensus that’s when Mr. Market jumps to the next narrative.
This basic lens acknowledges markets are discounting machines.
The Consensus is rarely a stable equilibrium.
Instead of working out ‘Which view is right?’ consider taking the ‘Outside In’ view that Nobel laureates Daniel Kahnemann and Amos Tversky wrote about in ‘Thinking Fast and Slow’.
Do Labor Shortages Cause Recessions
We enjoyed the Excellent Odd Lots show ‘Why So Many People Got This Year’s Economy Wrong’
An insight from the show that stuck with me: all recessions are preceded by labor shortages.
That reminds me of the following:
Markets top when there is no one left to buy. There is a shortage buyers.
Ultimately, employment drives consumption, spending and incomes. (Leaving aside transfers and corporate capex).
So, arguably, ‘economies top’ when there is no one left to hire.
It’s the same analogy to markets.
Example 1: In 1973, there was a massive labor shortage heading into a recession.
Looking at it in this lens, a labor shortage is a sign of slower growth ahead.
Example 2: The DotCom recession was marked by record low unemployment.
So, how has the US economy avoided a recession given reporting of labor shortages?
One factor - aside from the terming out of corporate & consumer debt - is record Visa issuance.
The US issued 1 MM new Visas in the last year or so to help relieve labor shortage and wage pressures.
Viewed in this lens, fiscal and monetary policy are not the only two levers to focus on.
1) Immigration policy and (2) AI policy (which boosts productivity) are two relevant levers governing the business cycle.
Food for thought.
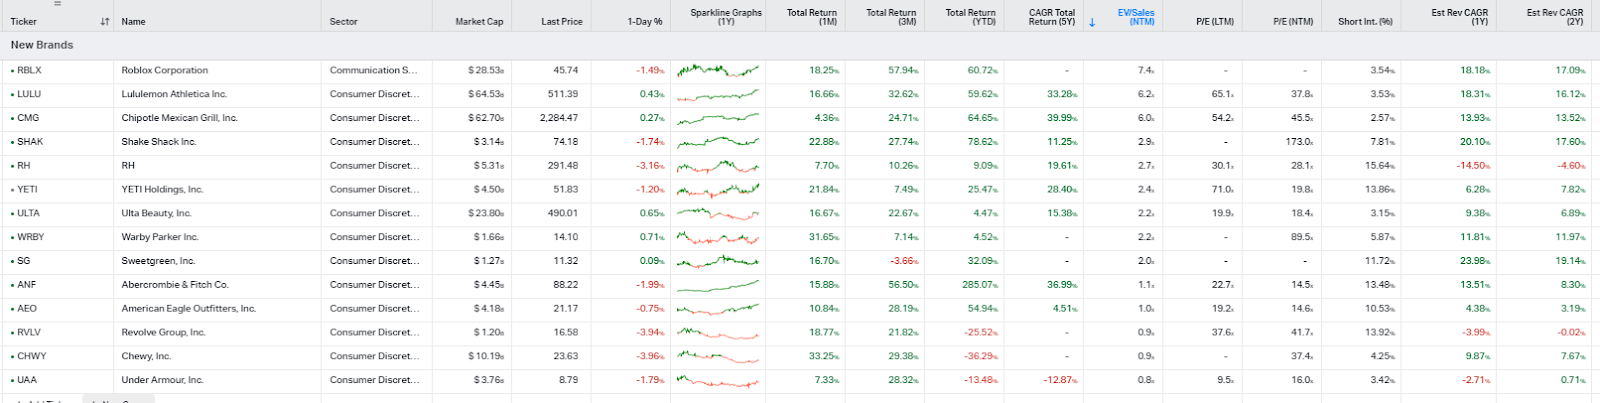
Retail Spend down from 4% YOY to 3%
US Consumer Mastercard Spending Pulse reported that retail sales during the holiday shopping season (from November 1 through December 24) were up just over 3% y/y.
The increase was weaker excluding the 7.8% increase in restaurant sales.
Let’s take a look at the performance of up and coming Consumer Discretionary brands.
Note that even though these are highly valued stocks, those stocks that have a lower relative valuation are outperforming.
Valuation always matters.
Markets
This section is a long read, we deep dive into all the things that mattered in 2023 and how they will shape the investment landscape in 2024.
The Markets Hit a Record 32nd Straight Overbought this year.
Last week, we did a market study on 2017 and concluded this is bullish.
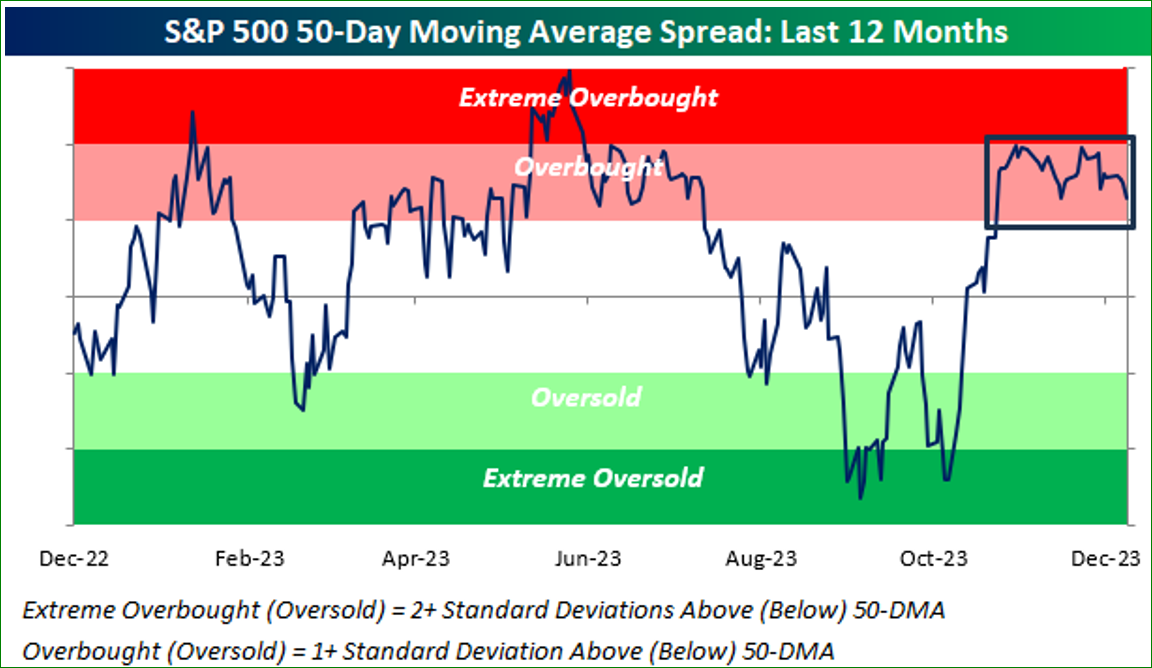
This week, we look at the last time stocks were overbought at this level.
That last time was 1985. So what happened in 1985?
Let's take a look …
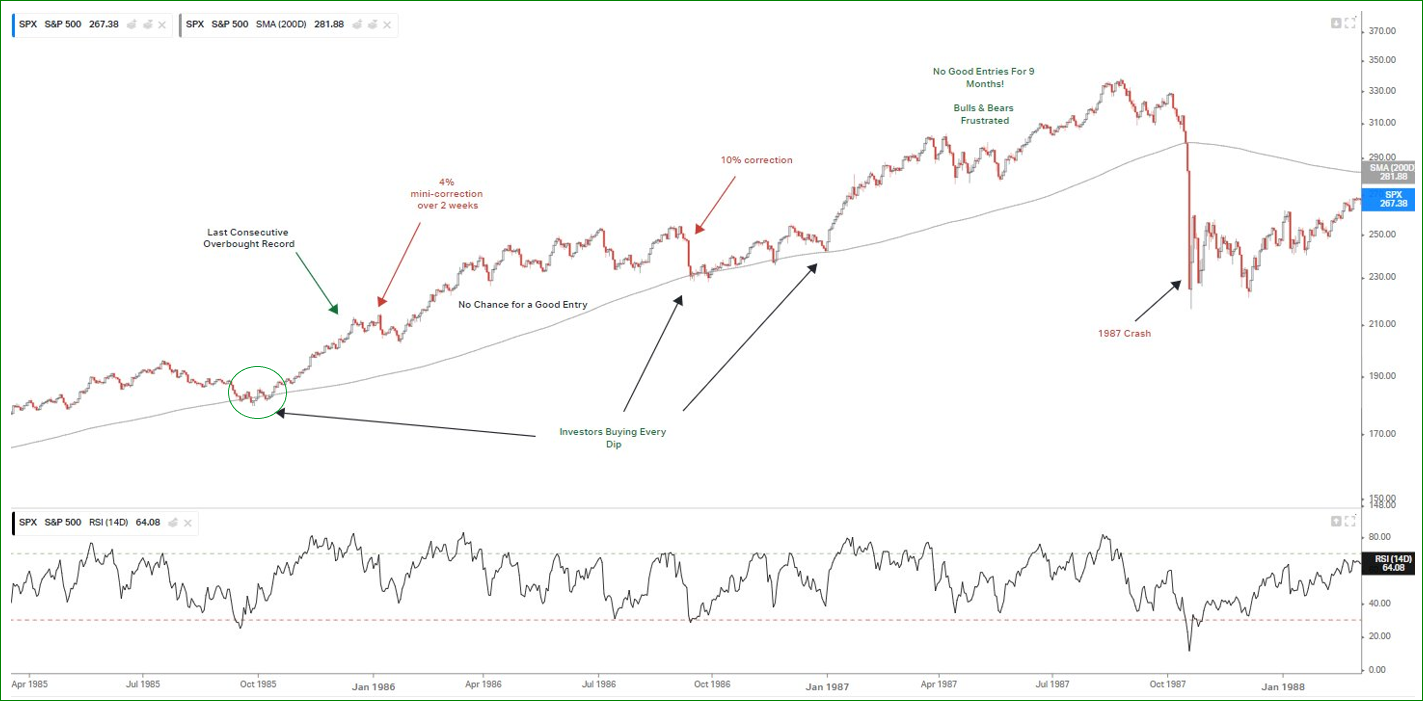
Highlights:
1985, and the following year, was a strong bull market
Investors had few good entry points.
That was in early October 85 when the S&P re-tested its 200 day moving average.
After October ‘85, markets took off and never looked back
Markets then rallied hard throughout the following year 1986 - which would correspond to our 2024
1986 was also an election year like 2024 - that’s also bullish
In Jan '86, which would correspond to next month, markets took a breather.
There was a ~4% correction that lasted only 2 weeks, then markets were off to the races again albeit with higher volatility.
The common feature: Bulls are frustrated by the lack of good entries. Bears are frustrated by "Up Only"
And that’s what we are experiencing today.
Both sides want the market to go down, and a re-test of the moving average doesn't happen until Sep 1986 - about 15% higher than the year started.
Isn't that similar to today?
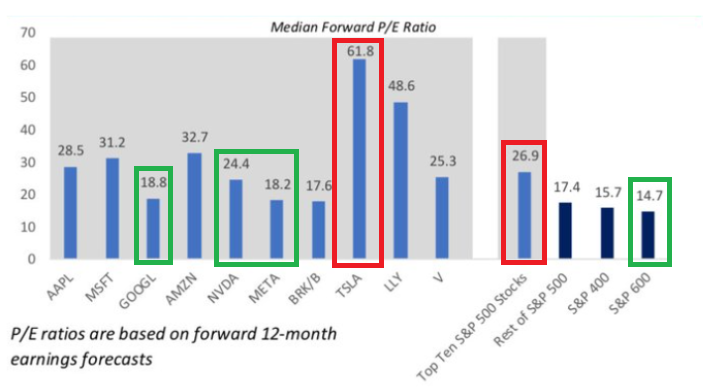
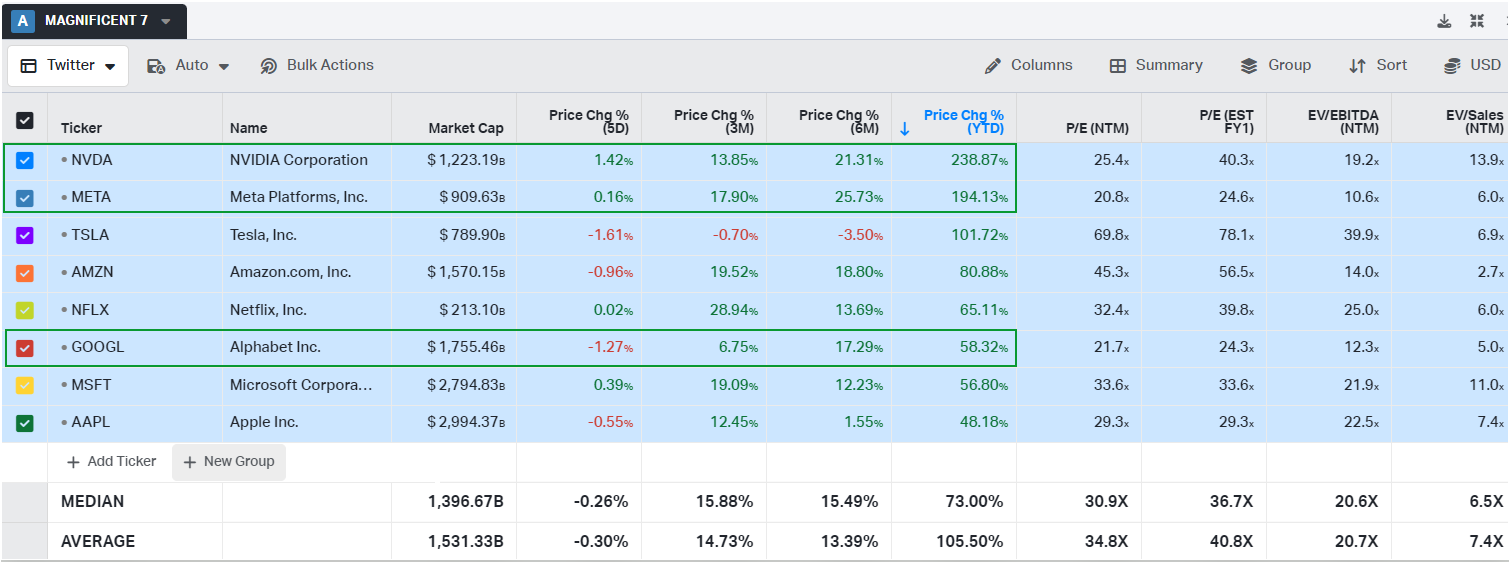
Mag 7 and Friends Have Top Heavy Valuations
Markets are poised to hit all time highs.
Well, how is Mag 7 doing? There is significant performance differentiation under the hood - and we expect that to continue next year.
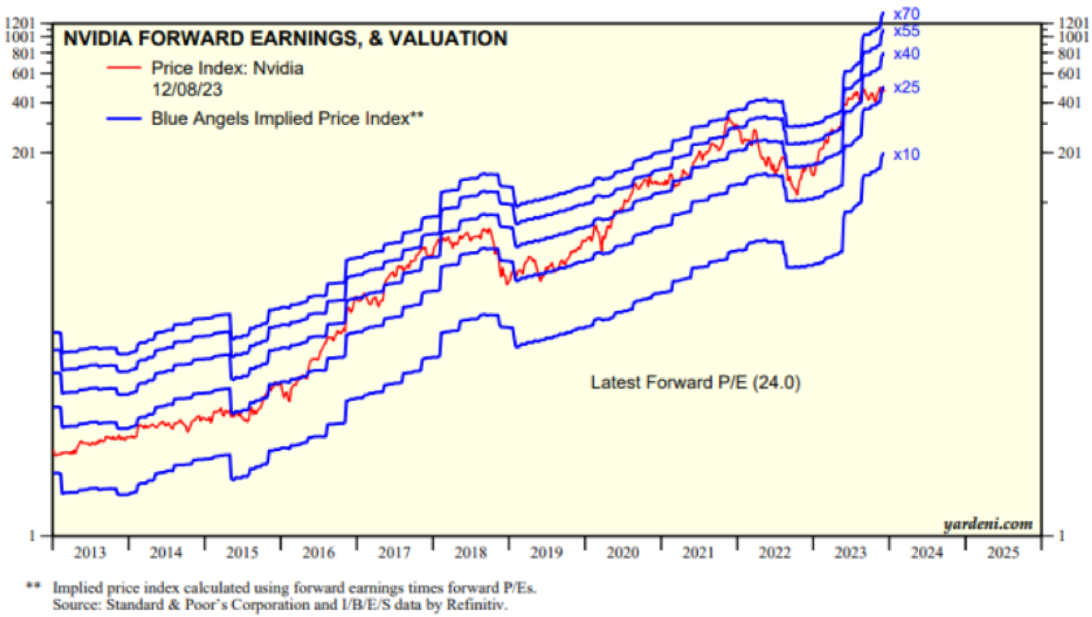
We prefer Google and Meta as over-weights. We also like that Nvidia has a forward P/E less than Apple.
We continue to believe that names like Tesla will under-perform due to high valuation and increasing competition from China. We also believe Apple will underperform due to mediocre earnings growth (< 1% YOY Earnings growth last quarter).
Are stocks over-valued?
Outside of Mag 7, stocks are reasonably priced. And we’ve been scooping great small caps and biotech firms that we believe will perform next year.
We comb through the 13F data of hedge funds specializing in small caps, and look for names that correspond to our thematic ideas.
We should note that we are seeing under-performance from over-valued tech names like Palantir, The Trade Desk, Snowflake, and Mongo DB.
We won’t walk you through the valuations here - but they are sky high.
The irony is even within growth stocks, stocks with better valuations are out-performing.
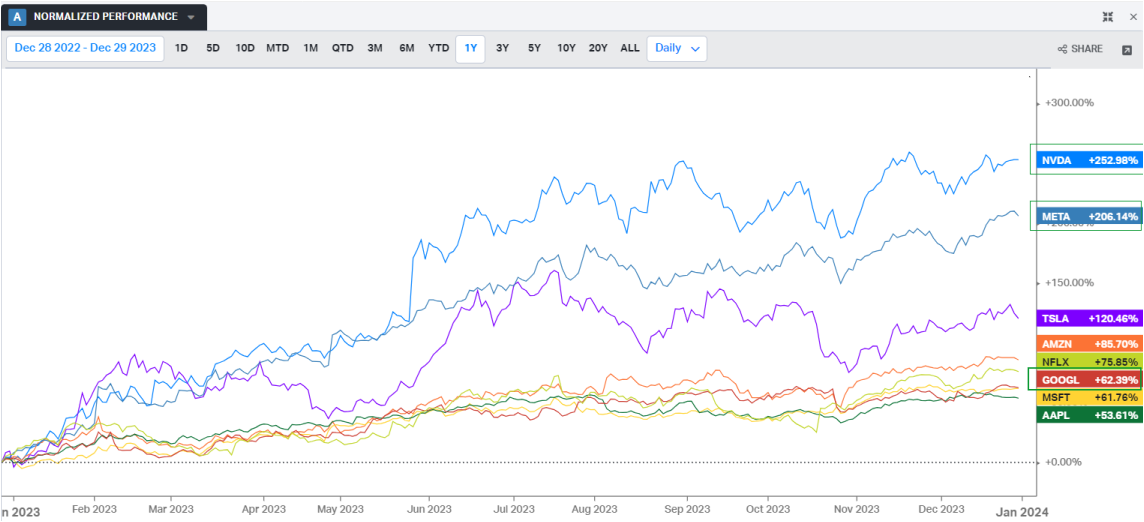
Meta, which did 100%+ this year, started the year at a low valuation - and it still offers relative value.
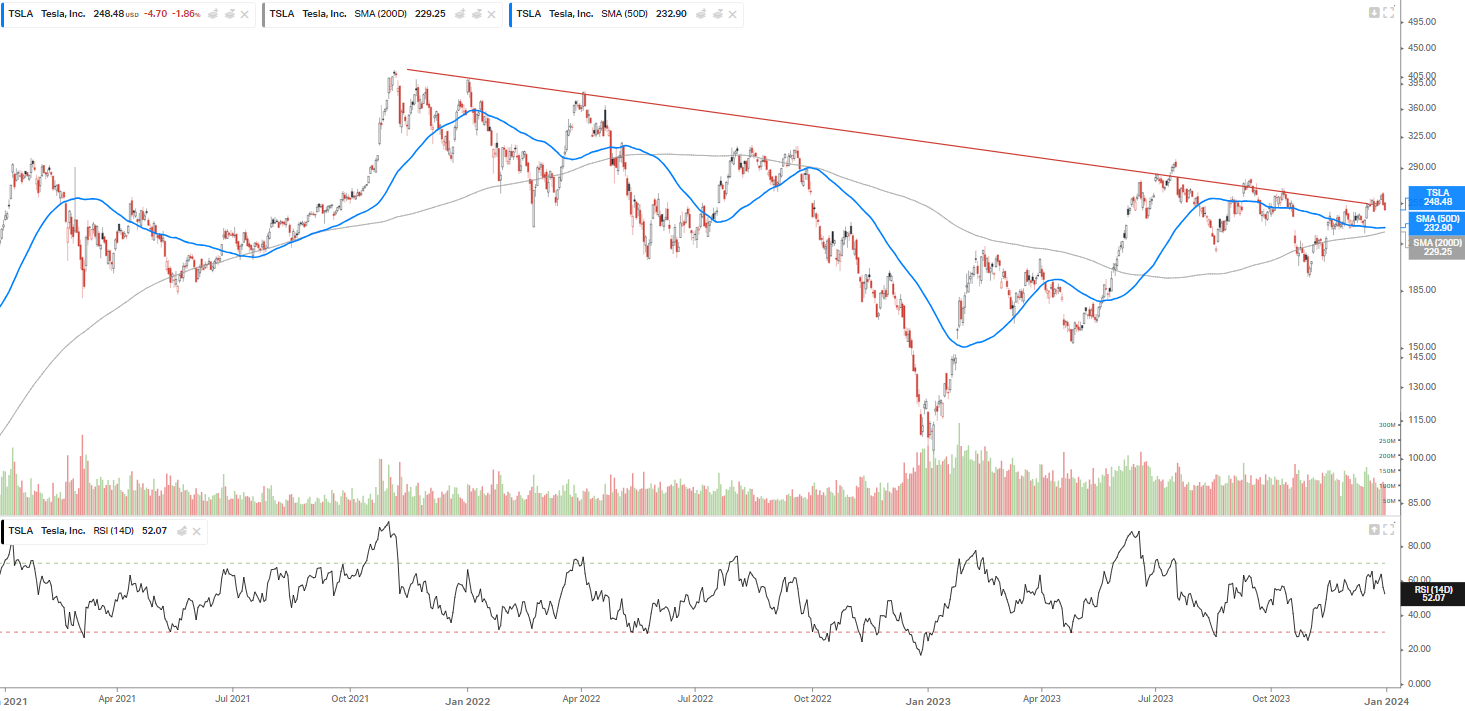
Tesla, a retail favorite and a stock hedge funds like to hate, remains in a downtrend. The stock has gone nowhere in 3 years whereas other Mag 7 stocks are at or near all-time highs.
Mag 7 Deepdive
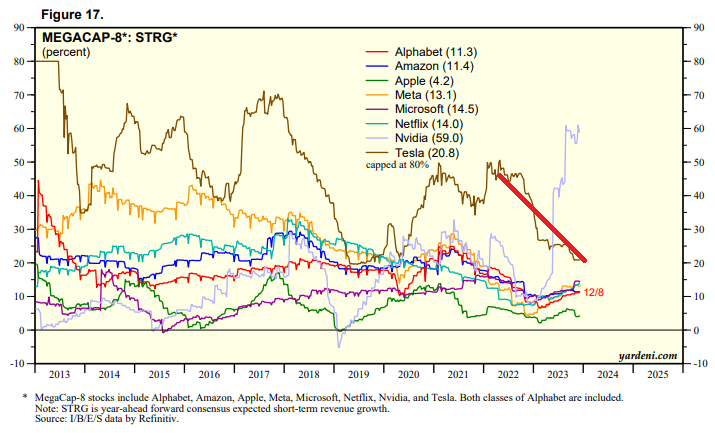
Let’s take a look at Mag 7 from a valuation, performance, and revenue expectations lens.
Our favored names are Nvidia, Google, Meta in the The Top 3 or 4.
Analysts are Wrong at Extremes
Now, let’s take a look at 2024 analyst earnings estimates.
We like the setup going into Q3 earnings because analysts forecasted 0% YOY earnings growth. That’s a low bar to cross.
Now, we have the opposite situation.
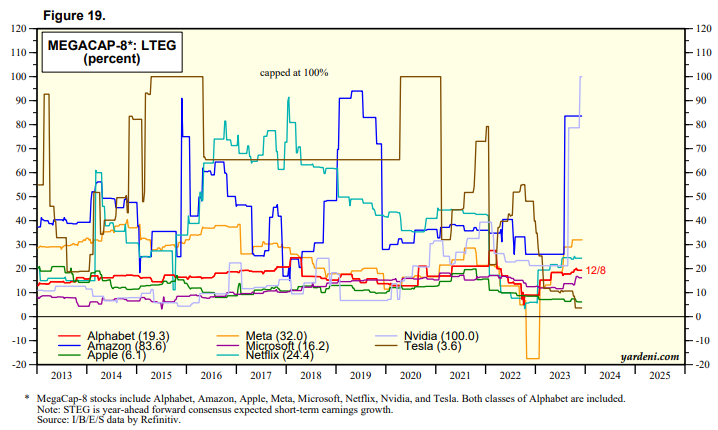
Take a look at the long-term earnings growth expectations (LTEG) of Mega Cap Stocks.
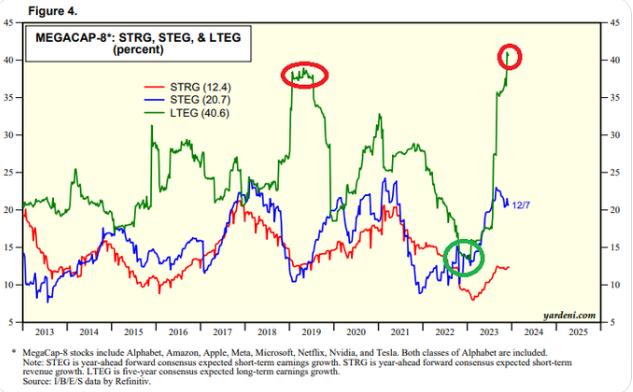
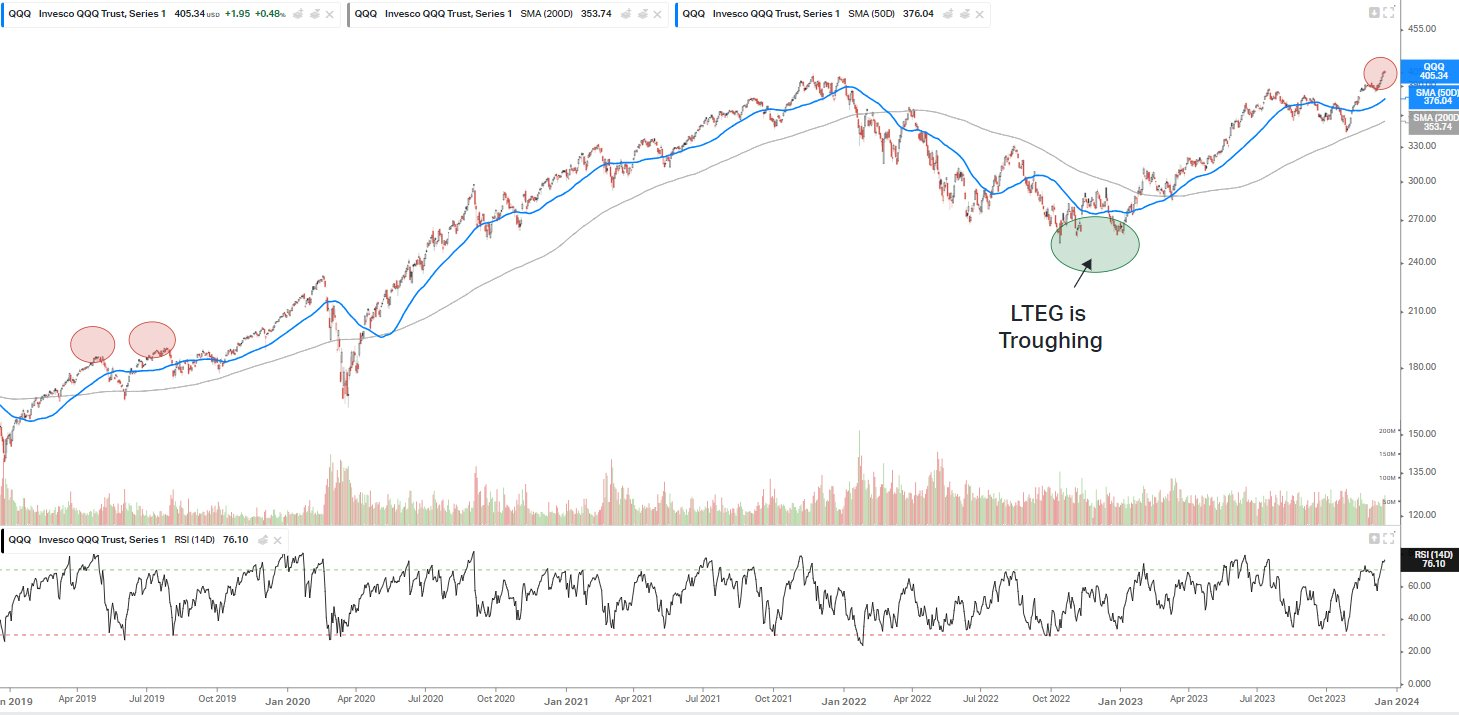
Notice when long-term earnings growth expectations (LTEG) were troughing at year-end 2022.
That was the best time to go long QQQ and Mega Caps. That was the contrarian move.
Also note when LTEG was peaking in 2019, QQQ experienced a correction. Again, it paid to be contrarian.
Analysts are wrong at extremes. There is a great book by David Dreman called ‘Contrarian Investment Strategies’ that marshalls decades of data to illustrate this and other points.
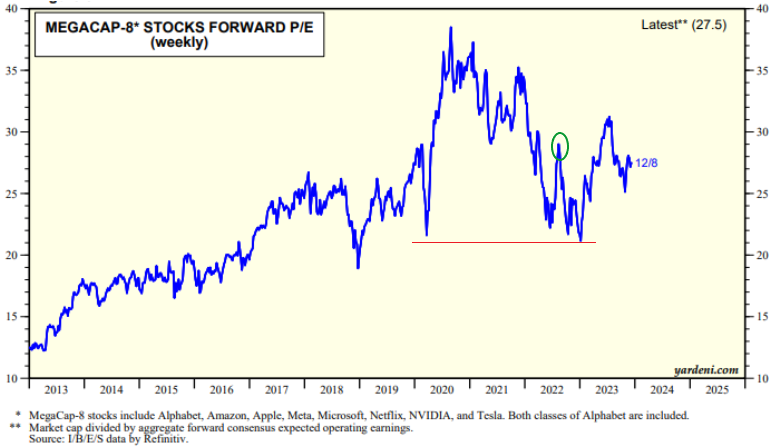
Mega Cap Stocks Valuations are Fairly Valued at Best
The Forward P/E on Mega Cap stocks are not at their 2022 peaks.
But they are far from trough levels.
In aggregate, they aren't a bargain.
Arguably mega cap stocks are near fully valued as a basket. And they have lagged the last several weeks.
Within Mega Caps, here's the relative valuation.
As we noted above, Tesla sticks out like a sore thumb. Tesla may get a short term bump on the Fed easing cycle story, but will ultimately lag its peers due to valuation.
Google and Meta are cheap.
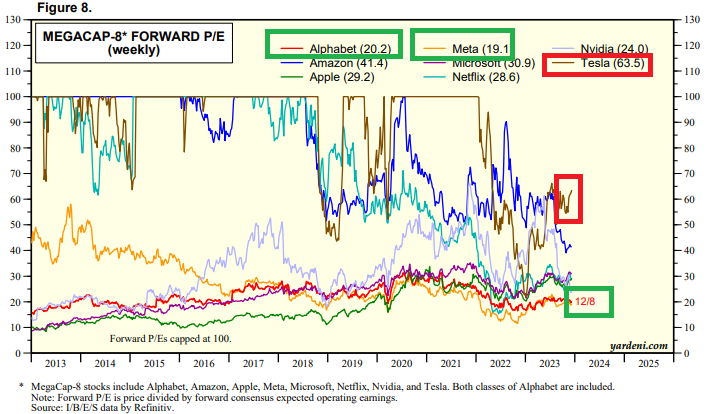
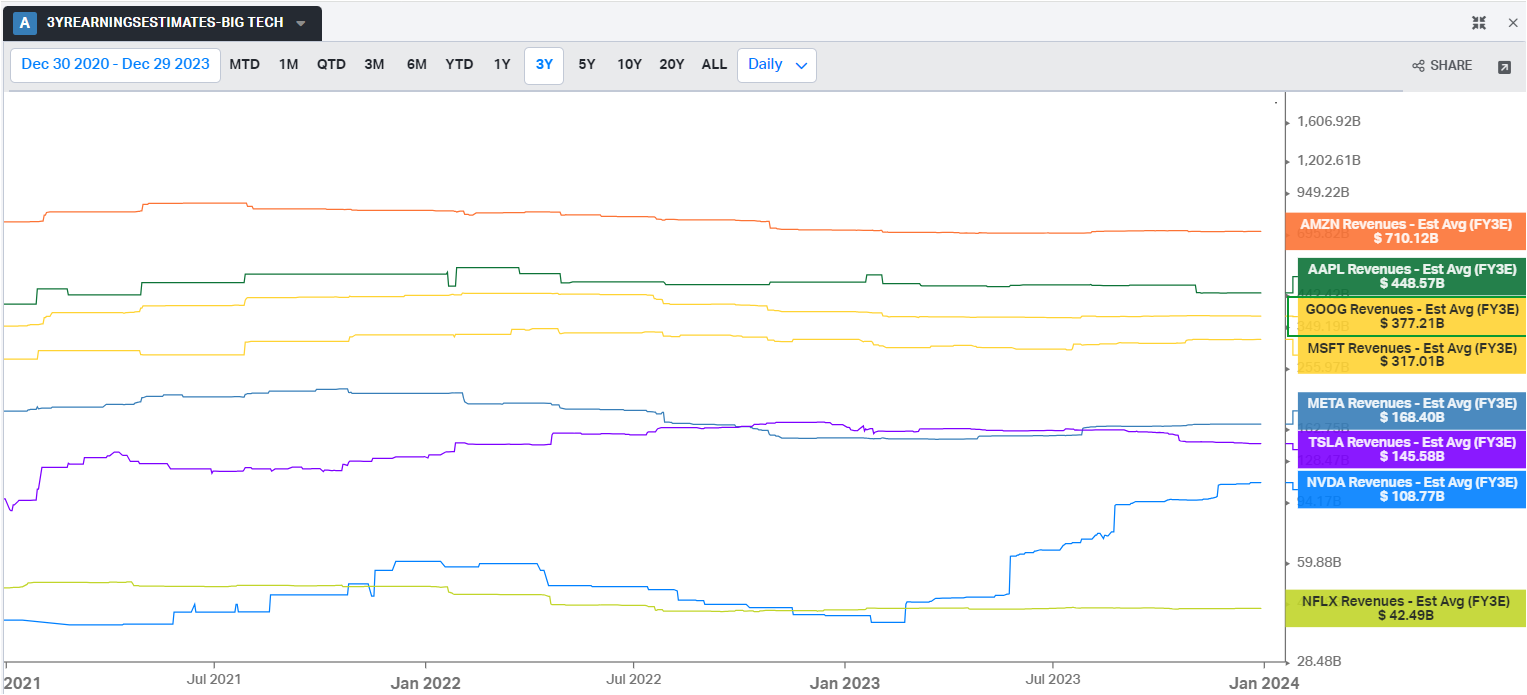
What about short-term revenue growth expectations of Mega Caps?
Tesla's rev growth expectations are declining, Nvidia's are ramping.
Apple's revenue growth can't get off the floor. Recall, Apple’s earnings growth last quarter was < 1%. And its revenue decline YOY. Apple is transitioning from a growth to value stock - and that will lead to PE compression.
I owned Apple for many years - and sold it in the early summer. A great business is not the same as a great stock!
Stocks rise in response to long-term earnings growth expectations.
Notice: Tesla and Apple have the lowest LTEG growth expectations.
Nvidia and Amazon are near the highest.
Google is at a balmy and sustainable 20% earnings growth. Meta is near 30%.
Both stocks are under-estimated.
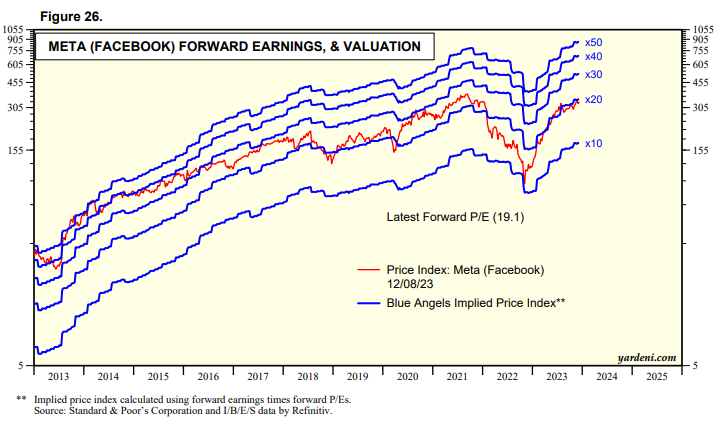
Meta, the stock everyone loves to hate, looks cheap relative to history.
Meta doesn't look like any AI narrative is priced in.
Consider that Meta has many levers to grow...including charging for WA should it choose to do so ('embedded real option')
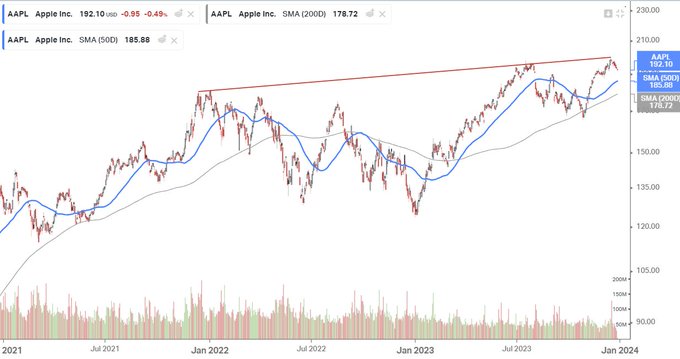
Apple, by contrast, is screaming 'overvalued'
We've been writing about Apple quite a bit.
We showed earlier how Apple's revenue and earnings expectations are barely off the zero mat
Apple is such a large company it's going to grow at the rate of the economy like a Consumer Staple
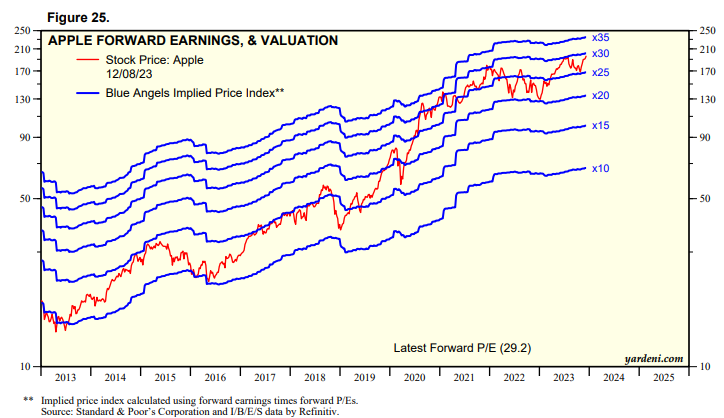
Apple is stuck in bed this holiday season.
Consider that the market is approaching All Time Highs without Apple. You want to own stocks with relative strength, not relative weakness.
Apple will continue to lag its Mag 7 brethren simply because it doesn't post strong earnings growth anymore.
Long-term earnings growth is the primary driver of valuation.
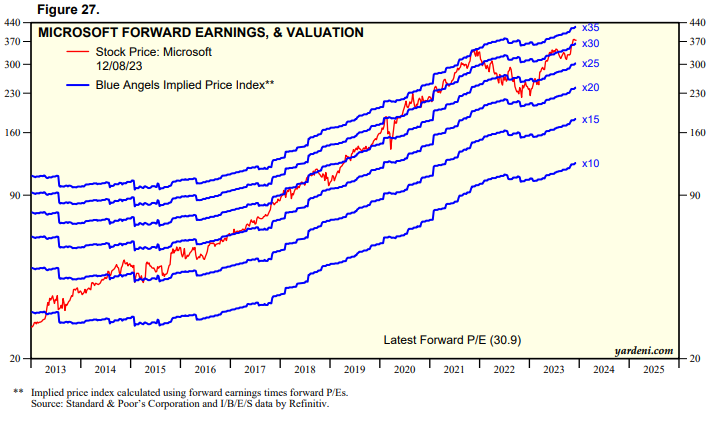
Microsoft, a business and management team I greatly admire, is also near peak valuations. Microsoft is as Consensus as it gets.
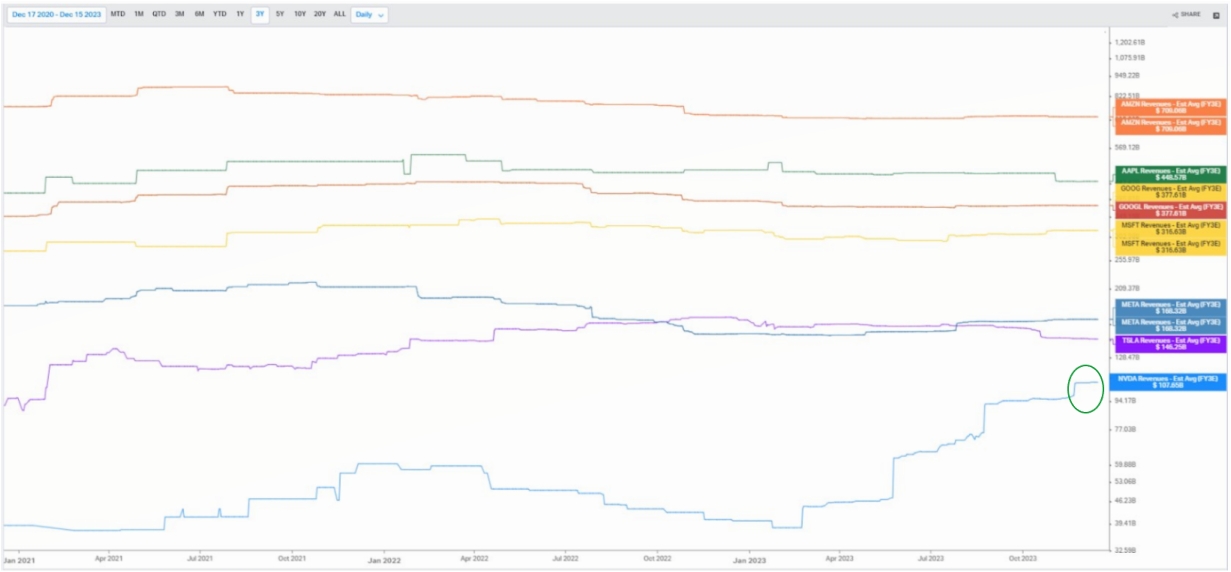
Notice Nvidia's revenue estimates are rising significantly.
Microsoft has an AI narrative bump...but Nvidia is generating true revenue growth
Nvidia has a forward PE of ~25
We believe Nvidia is under-owned by retail investors who over-own Tesla and Apple
Over the next few years, that may very well flip...
Our Rotation Thesis
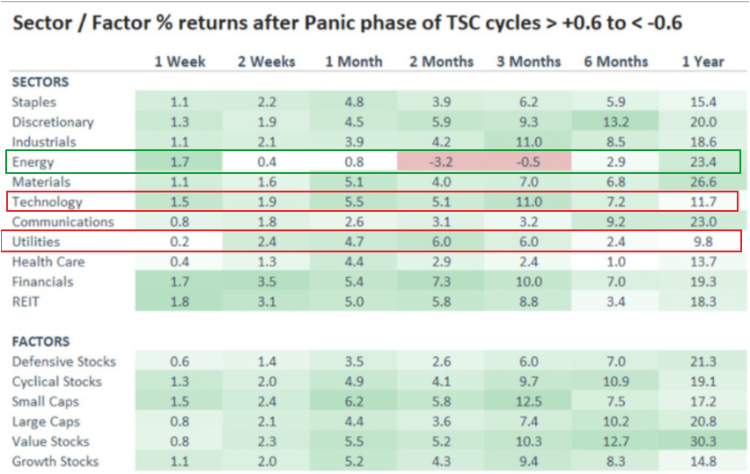
We highlighted in our last week's newsletter that we see value in the energy sector.
We believe that Energy stocks will continue to do well next year.
Tech is overbought. Tech is lagging now behind small caps and other cyclicals.
Take a look at this new study which shows what sectors perform after a panic like we saw in October.
The study coincides with our prior conclusion - over-weight energy, under-weight over-valued tech.
Quite a few other sectors look interesting as well - especially Value Stocks.
We’ve been loading up on value stocks like Hershey’s, Ali Baba, Build a Bear, American Public education, Avis in recent weeks.
We’re always on the hunt for disconfirming evidence to our views… We don’t see that.
Wall Street sell side S&P 500 year-end 2024 targets.
Most sell side firms expect S&P to rise next year.
With average target 4,861, Median target 4,875. We’re at 4,769 today.
+2.2% upside NTM.
We believe the sell-side is too cautious in their estimates, just like 2023.
Goldman had a 5% price forecast gain for the S&P they issued last month. The market delivered that and now Goldman has to re-up already.
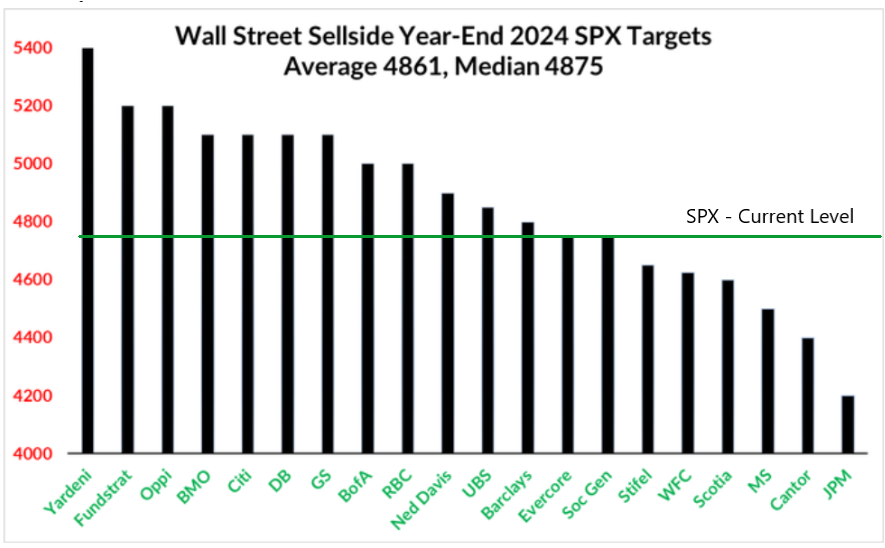
That said, we do expect some weakness in Q1 to shake-out the rapid rise in sentiment.
Marginal buys should focus on consumer staples, healthcare, energy and small caps.
When tech pulls back or corrects in time, then get back to semiconductors.
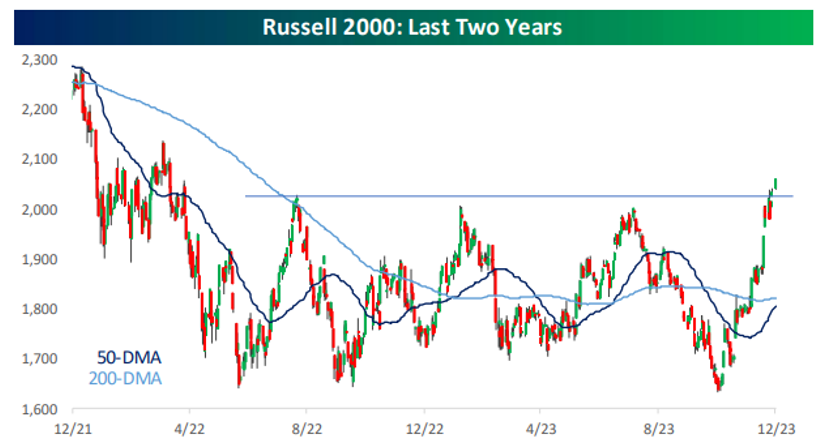
Small Caps breaks out to a new high
The small-cap Russell 2000 has finally cleared the top of the sideways range it had been in since mid-2022.
For 20 months, the Russell was range bound between 1,600 and 2,000.
We shared plenty of stats on small caps over the last 3 years.
Three years of small caps going nowhere are followed by small cap out-performance.
Also, if you look across decades, small caps outperform large caps.
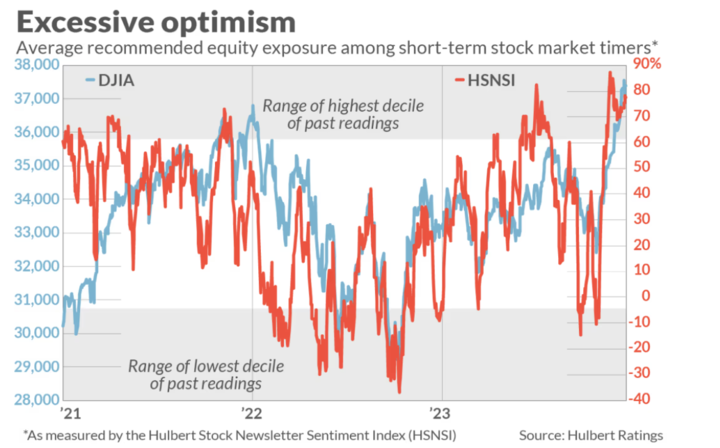
The Fly in the Ointment: Market Sentiment is at Historic Highs
Stock market timers are excessively bullish.
Their equity allocation levels of market timing newsletters, a contrarian indicator at extremes, are at the 92% percentile long.
Last year, hedge funds were short at the 99% percentile.
We have an inverse picture.
At the same time, we have all these studies suggesting market should be up next year.
That’s why we believe we’ll get a breather in Q1.
Now, markets may not pull back as much as investors might want. Think back to the study we shared at the top.
Markets dropped merely 4% after the last 30+ week overbought streak and never looked back.
This is all a sign we have a bull market - but you have to be thoughtful around your marginal buys.
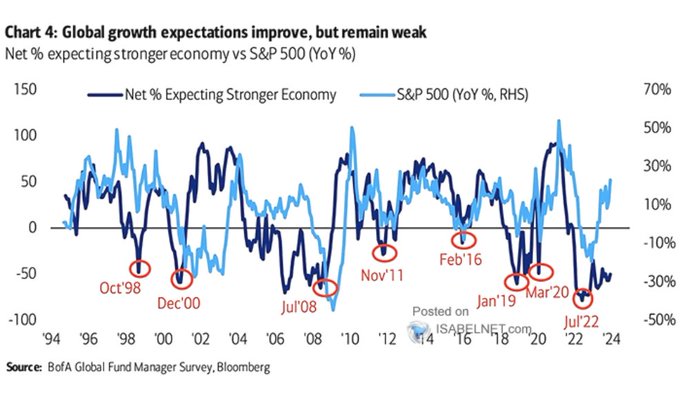
Fund Managers Pessimistic on Economy Despite Signs of Strength
Now, here’s the other side of Sentiment.
Professional money managers remain stuck on the view that the US economy will weaken.
If economic data continues to come in better than expected, markets will rally.
This data is contrarian bullish longer- term.
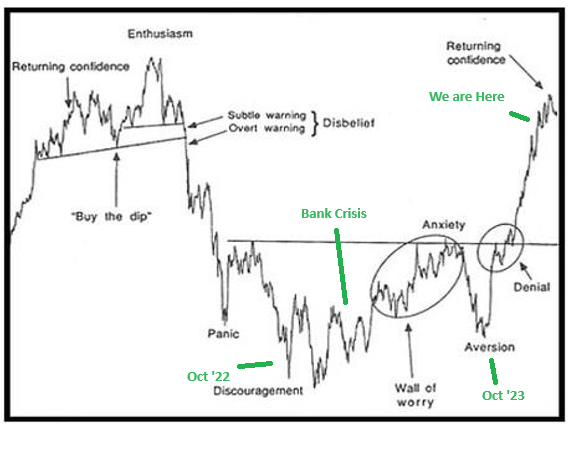
Market Study: Sentiment and Animal Spirits Matter
Check out this chart from Justin Mamis's book 'The Nature of Risk'.
The chart shows the stock market from May 1990 to March 1991.
That period was marked by awful geo-political and banking crisis events - sound familiar?
Events:
Iraq's invasion of Kuwait. (Compare to Russia/Ukraine or Hamas)
The Gulf War (started in Jan 1991)
S&L crisis was also present in the background.
Sentiment was awful.
Now, I overlaid this 1990 to 1991 chart with headlines from the last year or so.
Isn't the overlap uncanny?
Markets, at the first order, are a hot steamy ball of wax and emotion.
It’s our job to zoom out and look for where and when markets offer value.
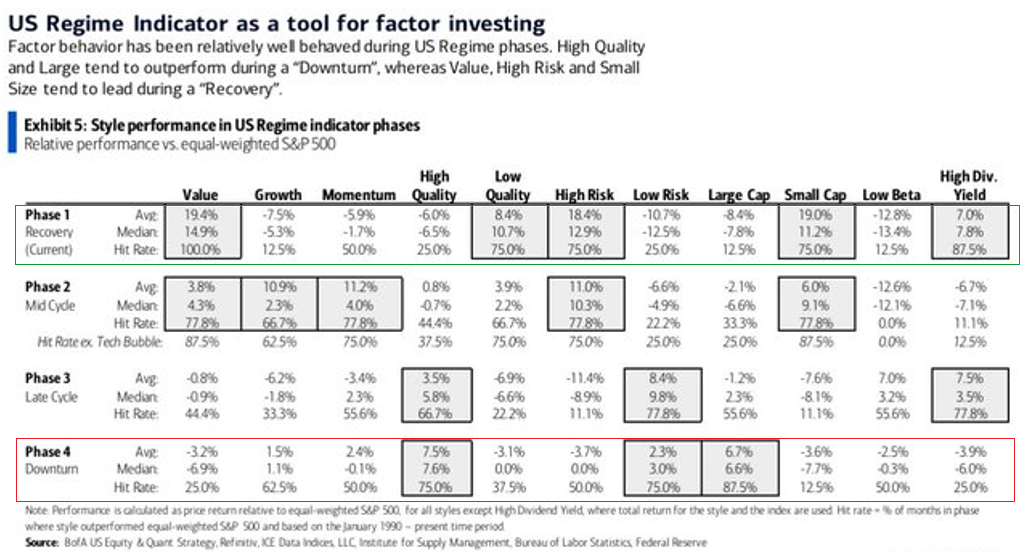
Are we in Early Recovery or Late Cycle?
Here’s another way to frame market outlook.
Take a look at Phase 1 and Phase 4 in this table.
Markets are behaving like Phase 1 now, and like Phase 4 in Aug to Oct
That’s the battleground.
This Friday ‘Phase 4’ Downturn stocks out-performed. Most of this quarter ‘Phase 1’ stocks out-performed.
You do want to own both to get diversification benefits - so long as you own great businesses at fair valuation entry points you’ll do fine.
Market Compass:
Now, let’s cycle through our three-prong market compass.
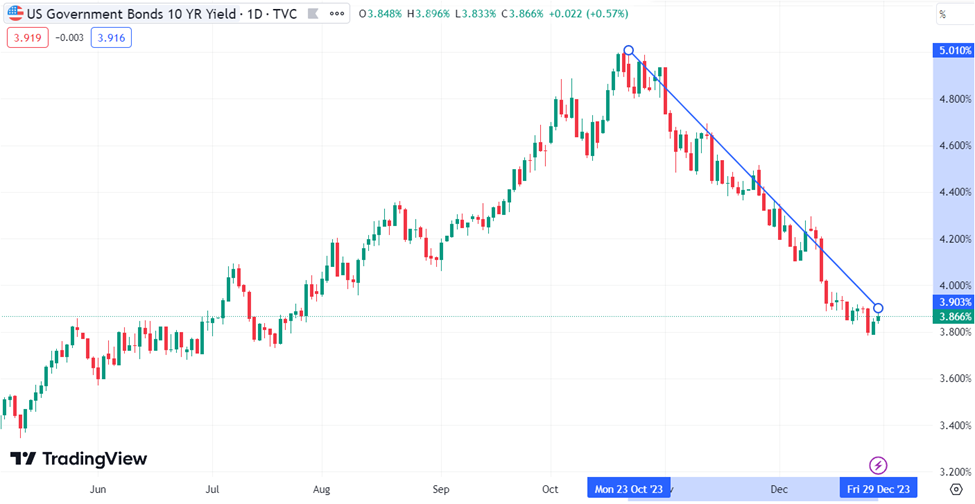
10-Year: The 10-year Treasury yield closed out the week at 3.88% down 2 Bps WoW after new inflation data showed cooling inflation pressures.
The 10-year yield recently reached its lowest level since July.
Lower 10-year yields are constructive for long duration risk assets like equities.
The ongoing winning streak in equities is closely linked to the record tightening observed in the 10-year Treasury.
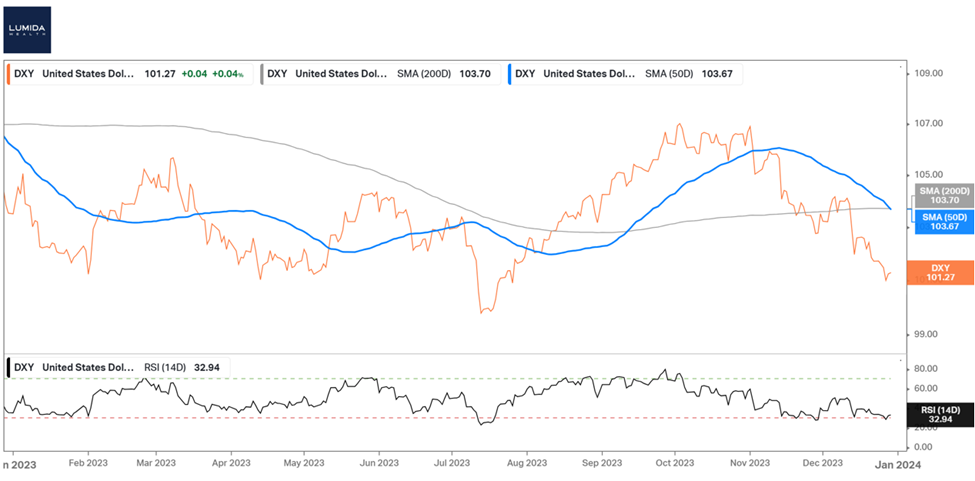
USD. The dollar continues to decline. That’s also bullish. However, there are signs that the USD is due for a bounce to its SMA. How low can it go?
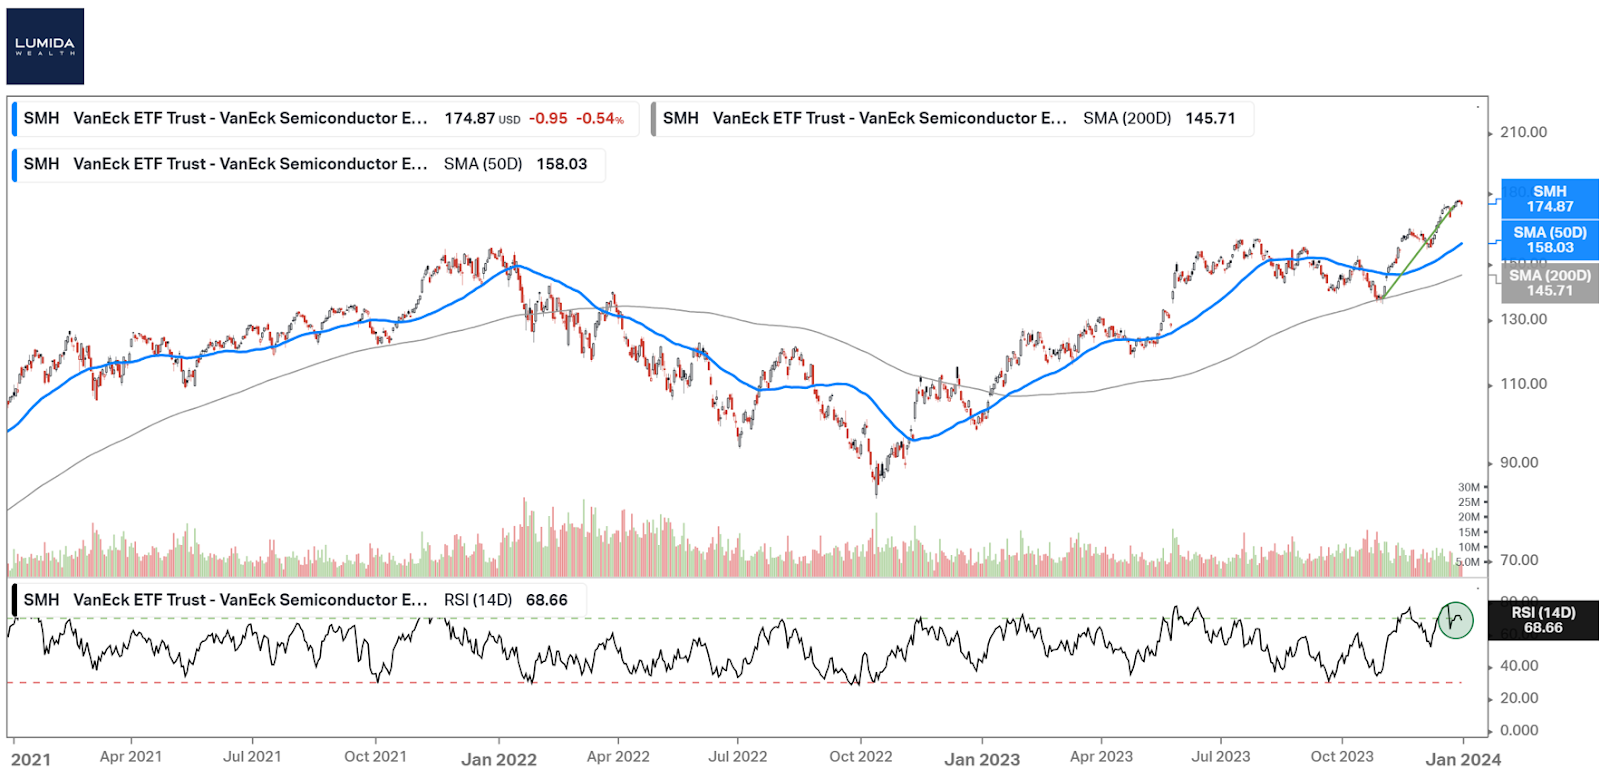
Semiconductors
Semiconductors have shown a steady upward trend over the year.
Semiconductors have seen a 12% increase since mid-September, with the semiconductor index recording a gain of 93 basis points in the past week.
SMH, the semiconductor index, is above the 50 day and 200 day moving average.
The AI narrative remains in full effect.
We do believe we’ll see Rotation from these winners to other sectors as we noted above
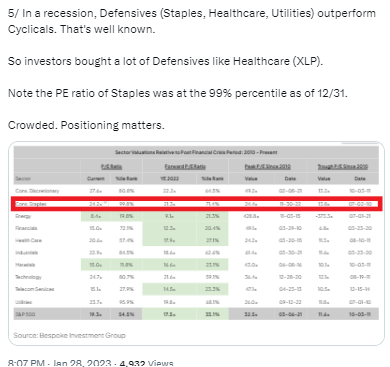
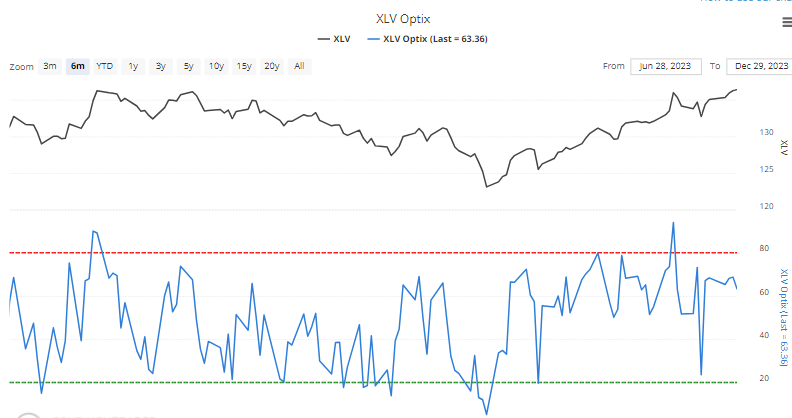
Healthcare Sector Is Attractive
Last year at this time, healthcare stocks were consensus and crowded. As were Consumer Staples. Market strategists were in a crouch position hiding in Defensives.
We went the other way - we saw the 99th percentile in the valuations of those sectors and concluded they were crowded.
This is a tweet we posted in January of last year making the point:
Today? Healthcare stocks are cheap. So we like healthcare in 2024. This is more evidence of the Great Rotation - or mean reversion at work.
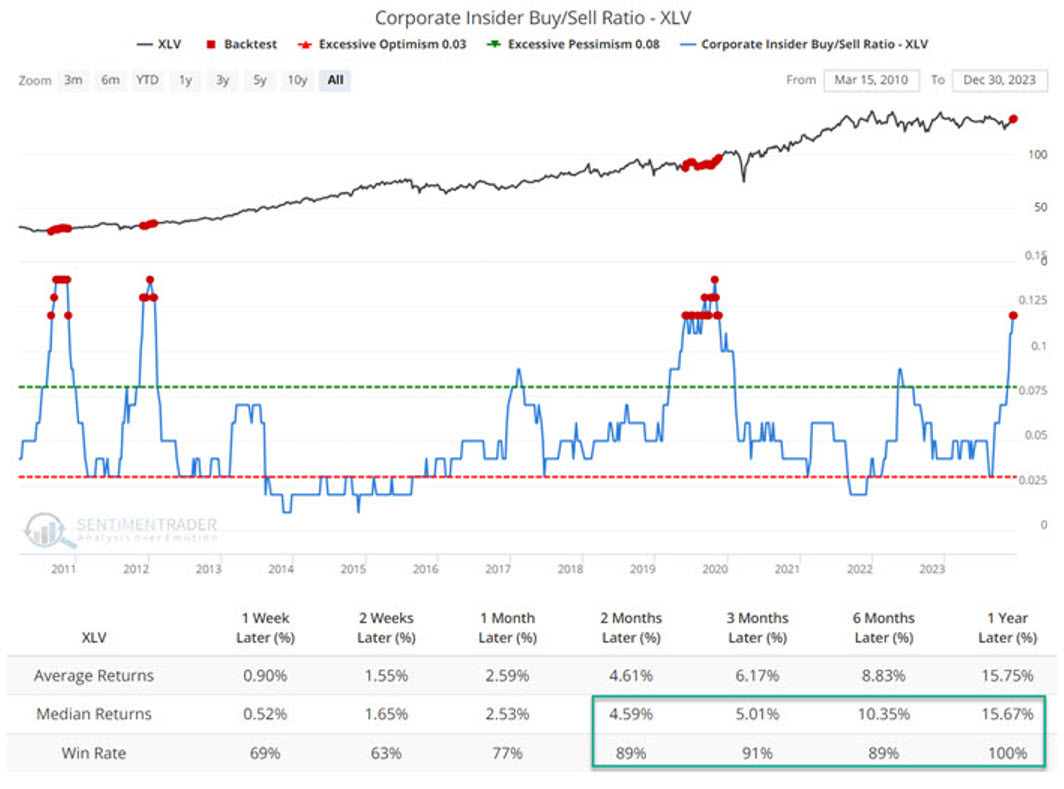
Healthcare execs are buying their own stock and have a near-record buy/sell ratio.
What are the forward return? A 16% median return in 1-year that greatly exceeds the average annual return of the S&P.
There are 5 or 6 healthcare stocks we like a lot.
One of the best performing healthcare stocks of the last 10 to 20 years was United Health. They simply have a fantastic business model.
We found a younger version of United Health - it’s growing faster, the stock is cheaper… and it is run by executives from non other than United Health. It’s called Elevance Health (ELV). It has a forward PE of 13.2 - much cheaper than United Health.
We are deploying Lumida clients into that stock and others.
We’d also add that healthcare stocks are overbought.
Add healthcare names to your watchlist so you are prepared to act in Q1.
Here’s another study we like from our friends at Renaissance Macro on healthcare:
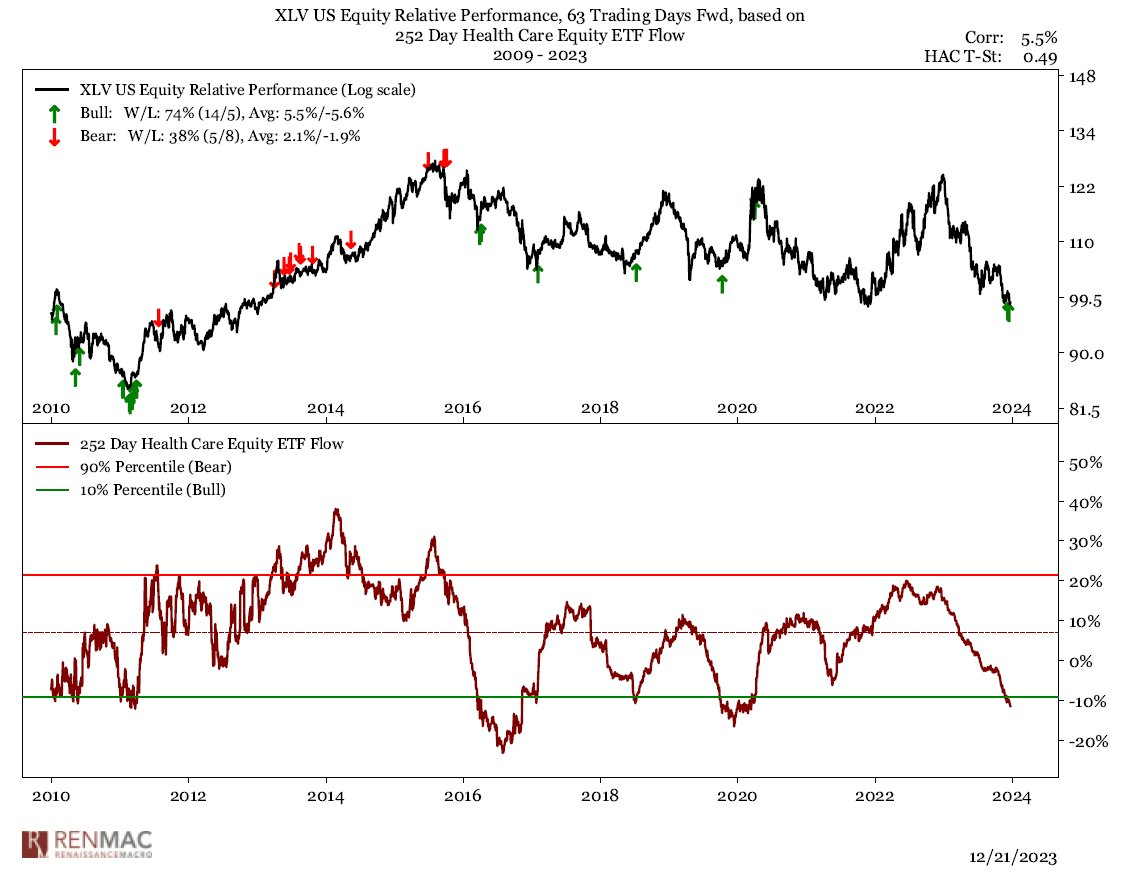
The study shows the public has grown tired of healthcare’s non-performance. There are record ETF outflows. When we’ve seen this in the past, it’s been a good time to buy.
Notice the record ETF inflows were a contrarian top indicator.
This reflects very much our philosophy and approach. We want to be countercyclical - buying stocks when they are out-of-favor, and selling them when animal spirits are high.
It’s hard for many people to do this psychologically. That creates our opportunity. That’s the hallmark of Non-Consensus Investing.
Nuclear Renaissance
In Europe, countries are divided on nuclear energy.
Sweden and Poland are starting or expanding their nuclear power like France is doing.
Belgium is keeping its newest nuclear plants running longer.
But Spain is choosing to stop using nuclear power, like Germany.
We bet on the French approach.
Long: Uranium - one of the best investments of the year

AI
Enterprises are projected to spend over $40 billion on generative AI solutions in 2024, indicating a 106% increase from the previous year, as per International Data Corp (IDC).
Top AI stocks encompass chipmakers, software firms, cloud service providers, and tech giants leveraging AI in diverse applications.
IDC forecasts the AI market to reach $151 billion by 2027, growing at an average annual rate of 86%.
We continue to view the AI application layer as crowded and are betting on the ‘picks and shovels layer’
Digital Assets
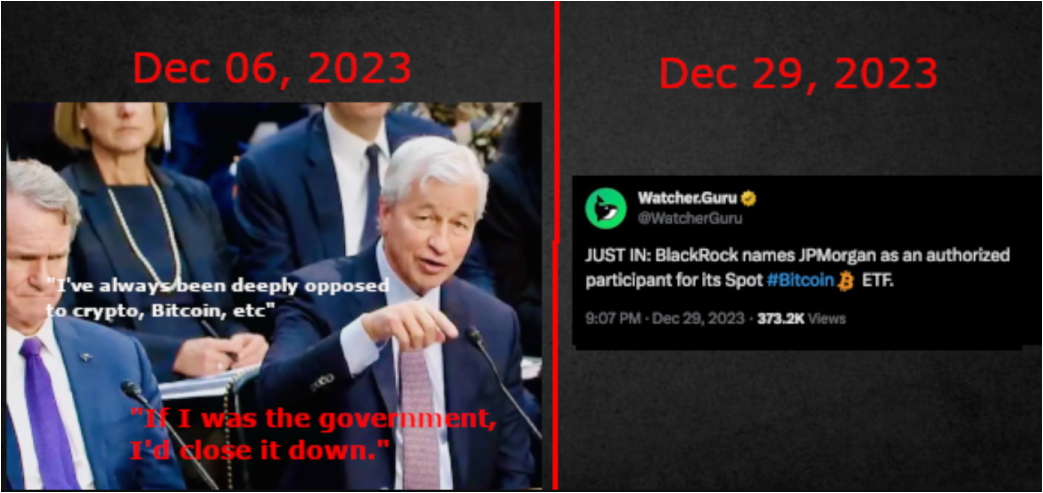
Jamie Dimon & JP Morgan on Bitcoin:
Amazing what a big difference 3 weeks can make.
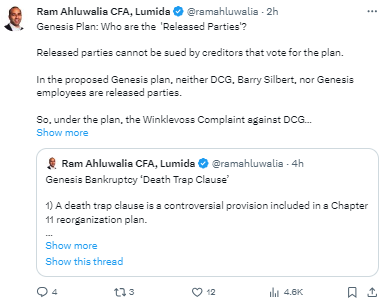
If you are a Gemini Earn creditor, we’re doing some analysis on what the recent Genesis bankruptcy proposal means for creditors.
We’re not a party to this in any form - neither a creditor, nor customer, nor counterparty to Genesis / DCG / Gemini - but want to help folks make sense of this mess.
Read here for more:
We are putting together a chartbook and are looking for a volunteer.
Check this post here.
The scope will cover market trends, narratives, derivatives / funding markets, and reviewing highlights from the best substacks.
Responsibility is to:
(1) add a 1 sentence summary or insight on each of the slides on attached, and
(2) add a highlight (e.g., a visual cue - a box overlaying an image, etc.) on charts where there is an insight to call out.
We will produce this weekly. It's about an hour of effort per week. The goal will be to publish on Friday, so the text would be updated on Thursday.
The commentary can be simply a summary of the main idea that the data is conveying, and noting any changes from prior weeks.
We don't need deep exegesis here.
Any volunteers? We'll feature your X handle and profile in the chart book. It could be a good way to get your brand out.
Quote of the Week
Price is what you pay. Value is what you get - Warren Buffett
If you enjoy the Lumida Ledger, please forward share with a friend or subscribe.
If you’re interested in learning more about Lumida’s wealth management services, please join our waitlist.

Disclaimer: Lumida Wealth Management LLC (‘Lumida”) is located in New York, NY, and is an SEC registered investment adviser. SEC registration does not constitute an endorsement of the firm by the Commission nor does it indicate that the adviser has attained a particular level of skill or ability. Lumida only transact business in those states in which it is registered, or qualifies for an exemption or exclusion from registration requirements. Any direct communication by Lumida with a prospective client will be conducted by a representative that is either registered or qualifies for an exemption or exclusion from registration in the state where the prospective client resides.
The information in this material has been obtained from sources believed to be reliable. While all reasonable care has been taken to ensure that the facts stated in this material are accurate and that the forecasts, opinions and expectations contained herein are fair and reasonable, Lumida, Inc. and Lumida Wealth Management LLC (collectively Lumida) make no representations or warranties whatsoever the completeness or accuracy of the material provided, except with respect to any disclosures relative to Lumida. Accordingly, no reliance should be placed on the accuracy, fairness or completeness of the information contained in this material. Any data discrepancies in this material could be the result of different calculations and/or adjustments. Lumida accepts no liability whatsoever for any loss arising from any use of this material or its contents, and neither Lumida nor any of its respective directors, officers or employees, shall be in any way responsible for the contents hereof, apart from the liabilities and responsibilities that may be imposed on them by the relevant regulatory authority in the jurisdiction in question, or the regulatory regime thereunder. Opinions,forecasts or projections contained in this material represent Lumida’s current opinions or judgment as of the day of the material only and are therefore subject to change without notice. Periodic updates may be provided on companies/industries based on company-specific developments or announcements, market conditions or any other publicly available information. There can be no assurance that future results or events will be consistent with any such opinions, forecasts or projections, which represent only one possible outcome. Furthermore, such opinions, forecasts or projections are subject to certain risks, uncertainties and assumptions that have not been verified, and future actual results or events could differ materially. The value of, or income from, any investments referred to in this material may fluctuate and/orbe affected by changes in exchange rates. All pricing is indicative as of the close of market for the securities discussed, unless otherwise stated. Past performance is not indicative of future results. Accordingly, investors may receive back less than originally invested. This material is not intended as an offer or solicitation for the purchase or sale of any financial instrument. The opinions and recommendations herein do not take into account individual client circumstances, objectives, or needs and are not intended as recommendations of particular securities, financial instruments or strategies to particular clients. The recipients of this material must make their own independent decisions regarding any securities or financial instruments mentioned herein and should seek advice from such independent financial, legal, tax or other adviser as they deem necessary. Lumida may trade as a principal on the basis of its views and research, and it may also engage in transactions for its own account or for its clients’ accounts in a manner inconsistent with the views taken in this material, and Lumida is under no obligation to ensure that such other communication is brought to the attention of any recipient of this material. Others within Lumida may take views that are inconsistent with those taken in this material. Employees of Lumida not involved in the preparation of this material may have investments in the financial instruments or securities (or derivatives of such financial instruments or securities) mentioned in this material and may trade them in ways different from those discussed in this material. This material is not an advertisement for or marketing of any issuer, its products or services, or its securities in any jurisdiction.